
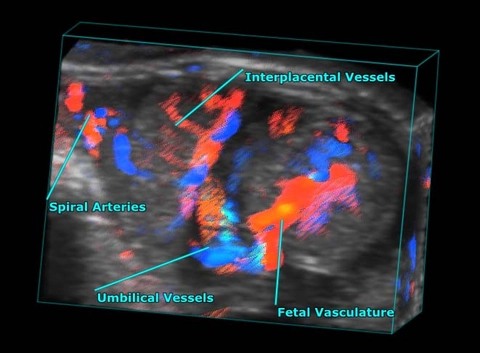
Mid-gestational Mouse Fetus and Placenta
3D color Doppler rendering of a mid-gestational mouse fetus and placenta, highlighted placental and fetal vasculature.
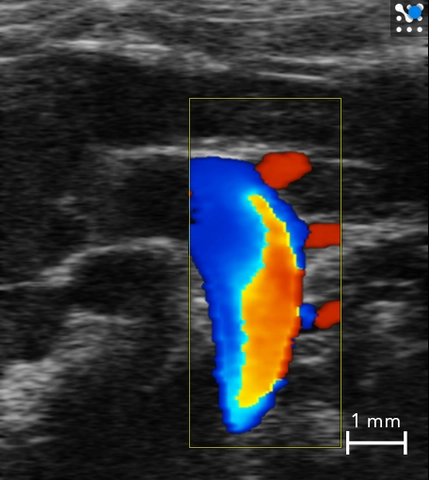
Mouse Aortic Arch
Color Doppler image of the aortic arch in a mouse showing all three branches.

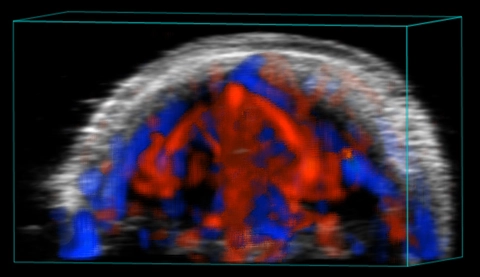
Blood flow in the neonatal rat brain
3D rendered color Doppler (red and blue) and ultrasound (greyscale) coronal image showing direction and velocity of blood flow in the neonatal rat brain.
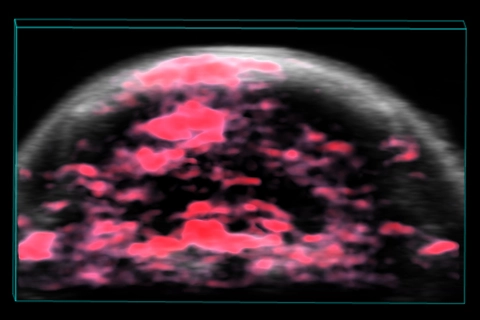
Ischemia/hypoxia stroke model
3D rendered coronal ultrasound (greyscale) and photoacoustic (red) images of a mouse brain during ligation of the right common carotid artery. The red color represents higher oxygen saturation clearly showing lower sO2 in the right hemisphere.

Blood flow in the mouse head
3D rendered color Doppler (red and blue) C-scan image showing direction and velocity of blood flow in the mouse brain and surrounding structures.
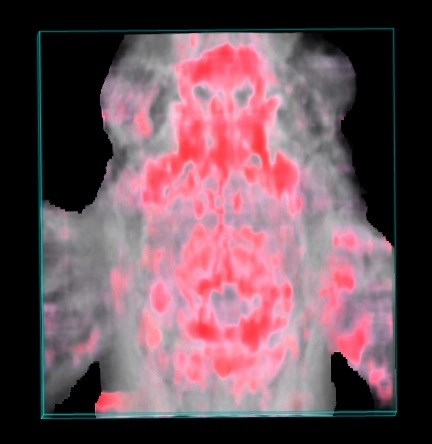
Oxygen saturation map in the mouse brain
3D rendered co-registered ultrasound (greyscale) and photoacoustic (red and white) image showing a parametric map of oxygen saturation with red signals indicating higher sO2 values.
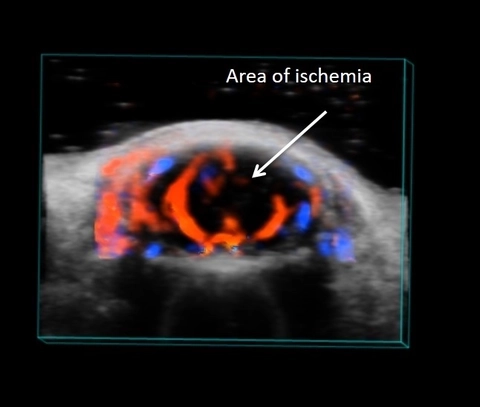
Ischemia/hypoxia stroke model
Co-registered 3D rendered ultrasound (greyscale) and color Doppler (red and blue) coronal image of a mouse brain during ligation of the right common carotid artery. The red and blue color represent blood flow velocity and direction clearly showing impaired blood flow in the right hemisphere.
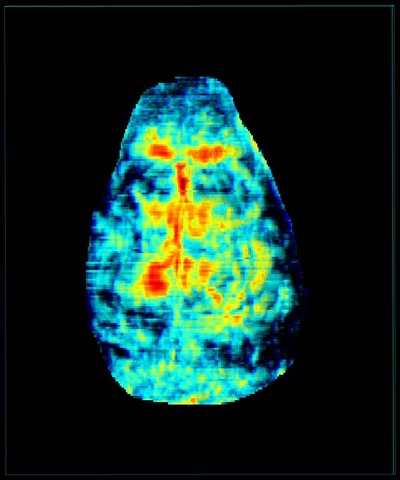
Blood signal in mouse brain
3D rendered photoacoustic image showing cerebral blood signal in the mouse brain.
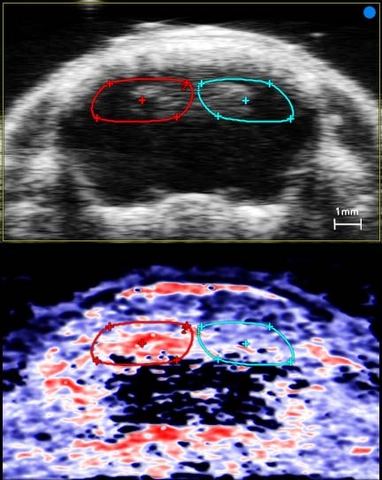
Ischemia/hypoxia stroke model
Ultrasound (top) and photoacoustic (bottom) coronal images of a mouse brain during ligation of the right common carotid artery. The red, white and blue color represents a parametric map of oxygen saturation clearly showing lower sO2 in the right hemisphere.
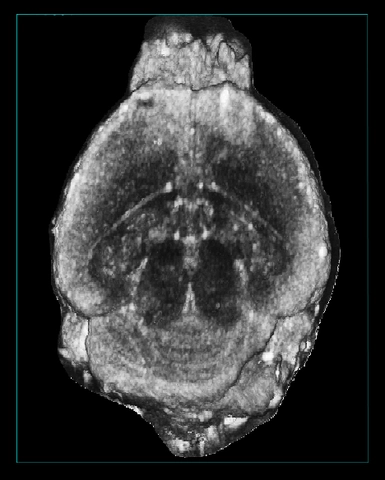
Mouse brain transverse section
High-resolution 3D ultrasound image of a transverse section of an excised CD-1 mouse brain at 40MHz. Such images are used in the Vevo BRAIN anatomical atlas.
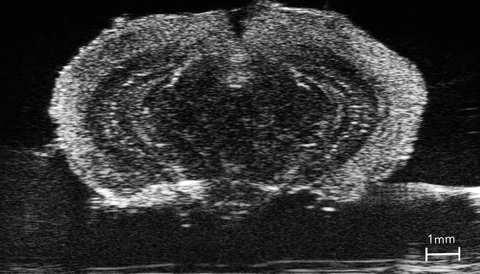
Mouse brain coronal section
High-resolution ultrasound image of a coronal section of an excised CD-1 mouse brain at 40MHz. Such images are used in the Vevo BRAIN anatomical atlas. Learn more about neuroimaging in vivo.
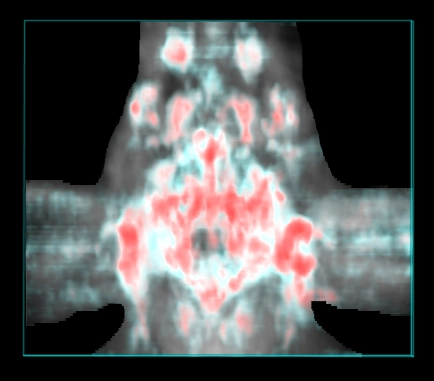
Oxygen saturation map in the mouse brain
3D rendered co-registered ultrasound (greyscale) and photoacoustic (red, white and teal) image showing a parametric map of oxygen saturation with red signals indicating higher sO2 values.