Cardiology
Quantify cardiac function and structure non-invasively and in real-time!
Your Best Tool For Mouse Echocardiography
Rapid, Repeatable and Well-Established; Ultra High Frequency ultrasound, using the Vevo Imaging Systems, will have an incredible impact on cardiovascular research in your animal models.
Perform reliable echocardiography in mice and other small animals for translational cardiovascular research with in vivo resolution down to 30 microns. Vevo ultrasound imaging platforms provide the best temporal and spatial resolution compared to MRI, conventional ultrasound and CT.
With the Vevo Imaging Systems you can:
- Perform cardiovascular phenotyping for cardiac structure and function
- Image the heart in 4D!
- Quantify diastolic dysfunction
- Evaluate cardiac strain (synchrony and deformation globally or regionally)
- Perform image-guided cardiac injections
- Monitor full animal physiology while imaging: body temperature, ECG and respiratory rate throughout the imaging session.
- Ideal for stress echo and cardiotoxicity studies.
- Assess myocardial oxygen saturation
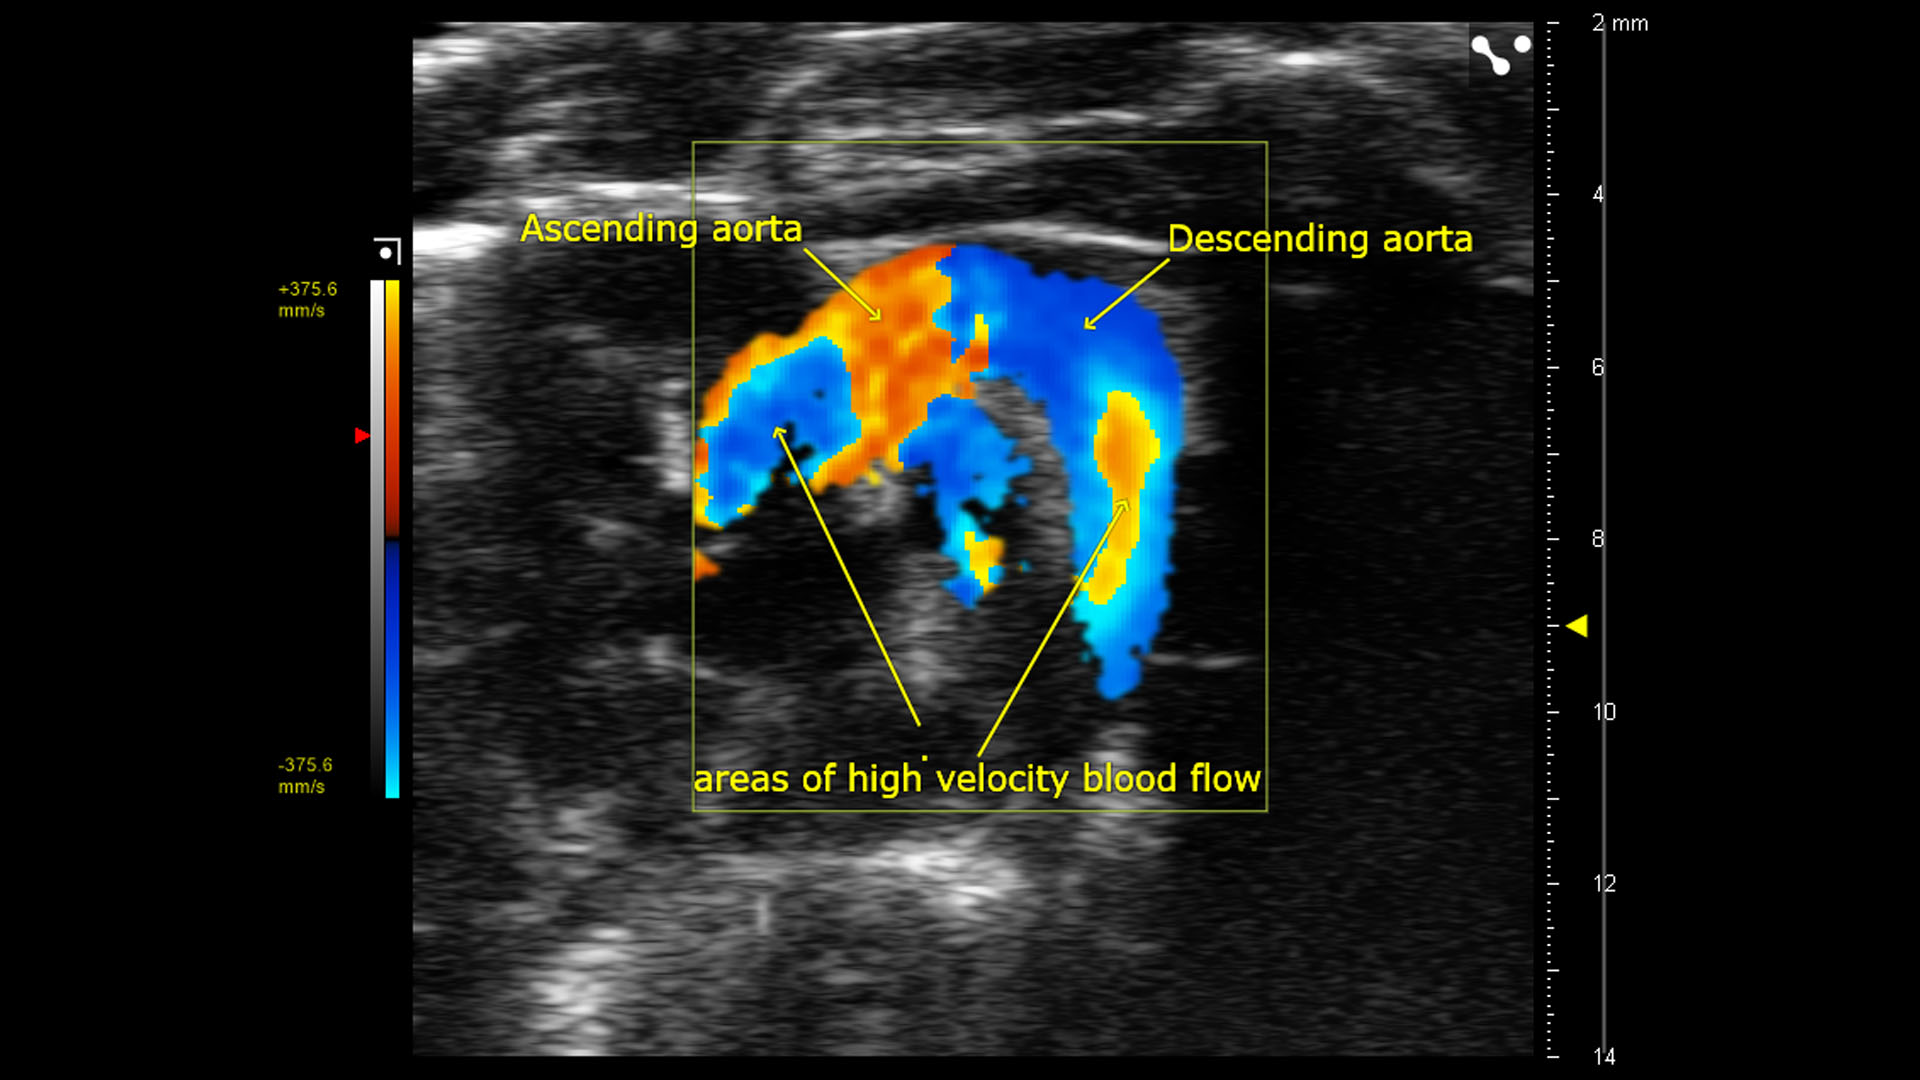
Mouse left ventricle imaged with 4D Mode from a parasternal long axis view.

Standard mouse echocardiography. Left Ventricular measurements taken from a B-Mode parasternal long axis image.

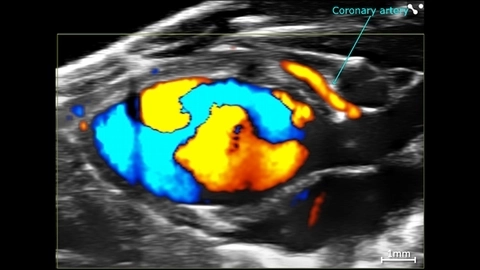
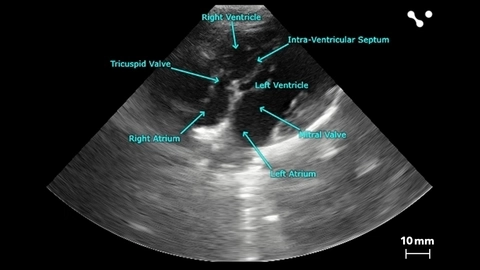
Mitral flow visualized from an apical view of the mouse left ventricle to assess diastolic function.

B-Mode ultrasound with myocardial oxygen saturation acquired using photoacoustics (PA EKV Mode), from a parasternal long axis view of the mouse left ventricle.
Use Vevo Echocardiography to Image any Cardiac Disease Model, Including:
- Myocardial Infarction
- Cardiotoxicity
- Valvular Disease
- Cardiac Hypertrophy
- Cardiomyopathy
Downloaded or access resources related to Your Best Tool For Mouse Echocardiography
Quantification of murine myocardial infarct size using 2-D and 4-D high-frequency ultrasound
Machine learning driven contouring of high-frequency four-dimensional cardiac ultrasound data
Long-Term Electronic Cigarette Exposure Induces Cardiovascular Dysfunction Similar to Tobacco Cigarettes: Role of Nicotine and Exposure Duration
Improving characterization of hypertrophy-induced murine cardiac dysfunction using four-dimensional ultrasound derived strain mapping
Photoacoustic properties of polypyrrole nanoparticles
Thank you for your patience. Your search results are loading.
Why are the values for Fractional Shortening (FS) different between analysis in M-Mode and B-Mode?
Is it possible to do strain analysis on EKV (ECG-gated Kilohertz Visualization) images?
What type of ECG signal is provided by the Vevo system?
Will AutoLV work without ECG input? Is there a workaround if there is no ECG data available?
Do you have baseline “normal” echo values for various mouse/rat models?
Why am I not able to visualize both E peak and A peak in mitral PW Doppler?
What formulas are used to calculate volume for Ejection fraction and other values in a long axis B-mode LV trace vs. short axis M-mode LV trace? Which formula is best?
Where would I be able to find the formulas used for the calculation of various echo parameters?
Why are values for systolic function different between LV long axis and LV short axis M-mode images? Which image should I use to calculate LV systolic function?
Essential Links
Request a Quote or Demo
Request Now
Watch the full video.
"The Vevo ultra high frequency ultrasound systems and linear array transducers are perfect for fast, high resolution imaging. The Vevo is extremely easy to use and the image quality is fantastic, opening up numerous biomedical applications we are only now beginning to explore."
-Craig J. Goergen, PhD
Leslie A. Geddes Associate Professor of Biomedical Engineering, Weldon School of Biomedical Engineering, Purdue University
Watch this in-depth interview with Dr. Craig Goergen: