Neurobiology Gallery

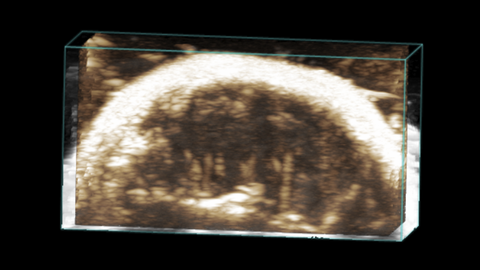
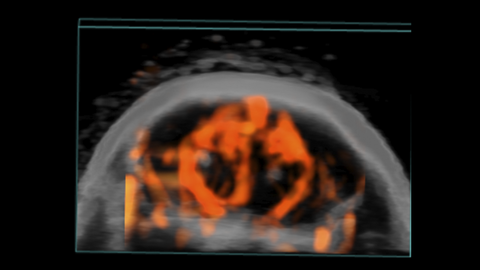
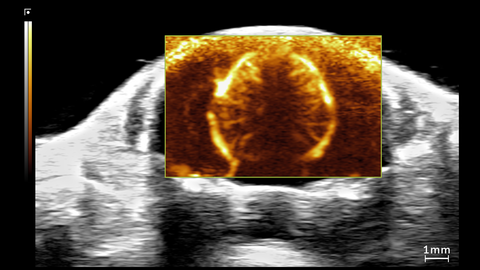
3D Non-linear Contrast of Mouse Brain
3D non-linear contrast view of a mouse brain. This was acquired using a UHF29x transducer on the Vevo F2xc imaging platform.
Oxy-Hemo View of Mouse Brain
Oxy-Hemo view of a mouse brain. This was acquired using a UHF29x transducer on the Vevo F2xc imaging platform.
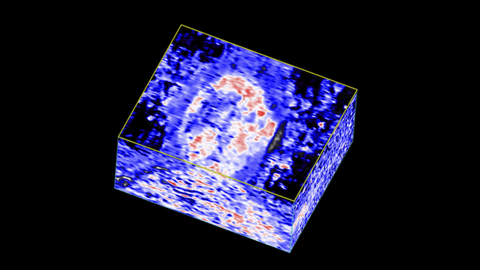
3D Oxy-Hemo View of Mouse Brain
3D Oxy-Hemo view of a mouse brain. This was acquired using a UHF29x transducer on the Vevo F2xc imaging platform.
Power Doppler view of Mouse Brain
Power Doppler view of a mouse brain. This was acquired using a UHF29x transducer on the Vevo F2xc imaging platform.
3D Power Doppler view of Mouse Brain
3D Power Doppler view of a mouse brain. This was acquired using a UHF29x transducer on the Vevo F2xc imaging platform.
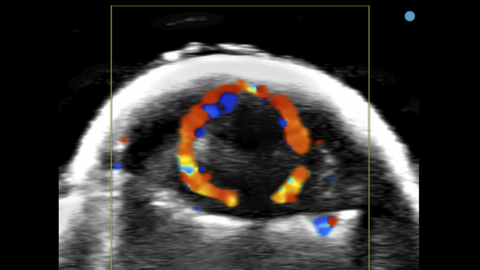
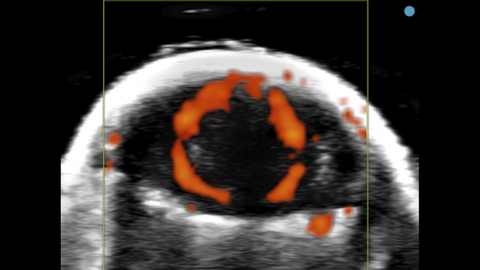
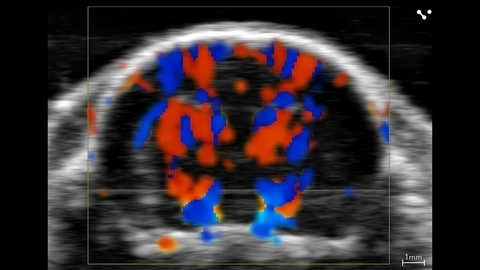
Color Doppler of Mouse Brain
Color Doppler view of a mouse brain. This was acquired using a UHF29x transducer on the Vevo F2xc imaging platform.
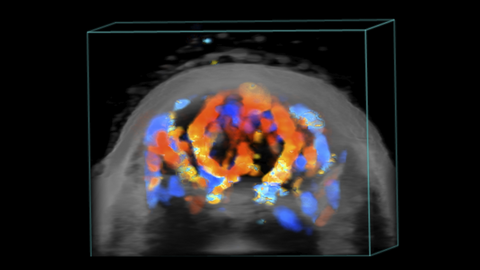
3D Color Doppler of Mouse Brain
3D Color Doppler view of a mouse brain. This was acquired using a UHF29x transducer on the Vevo F2xc imaging platform.
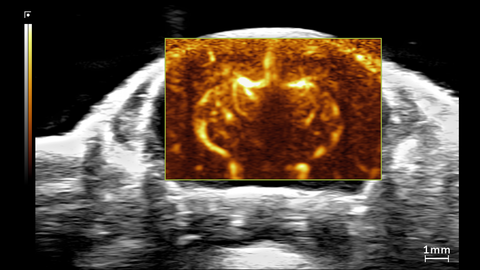
Ultrafast Doppler view of Mouse Brain
Ultrafast Doppler (UFD) view of the brain in a 1.5 month old CD-1 mouse. This was acquired using a UHF29x transducer on the Vevo F2xc imaging platform.
Ultrafast Doppler view of Mouse Brain
Ultrafast Doppler (UFD) view of the brain in a 1.5 month old CD-1 mouse. This was acquired using a UHF29x transducer on the Vevo F2xc imaging platform.
Juvenile rat cerebral vasculature
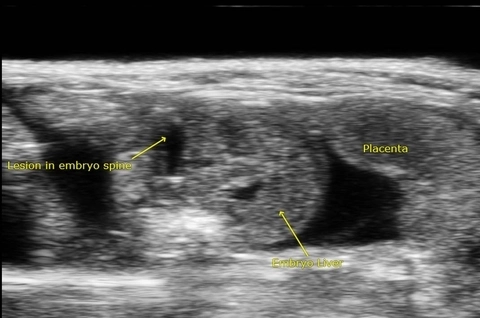
Lesion in Embryo Spine - Spina Bifida Rat Model
Spina bifida is a neural tube defect that results in incomplete closing of the spinal cord. Spina bifida is associated with abnormalities in the cerebellum and cisterna magna during fetal development. This image acquired using the Vevo 3100.
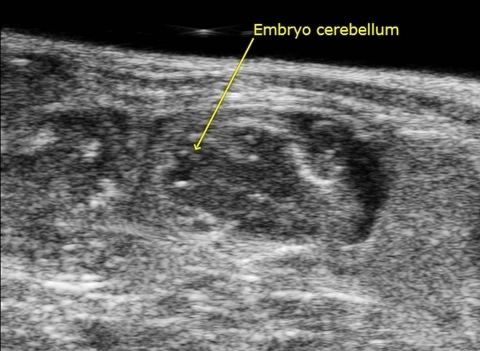
Embryo Cerebellum - Spina Bifida Rat Model
Spina bifida is a neural tube defect that results in incomplete closing of the spinal cord. Spina bifida is associated with abnormalities in the cerebellum and cisterna magna during fetal development. This image acquired using the Vevo 3100.
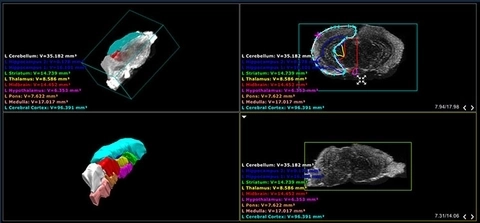
Screenshot of mouse brain atlas
Screenshot of the Vevo LAB software displaying several different views of the CD-1 mouse brain atlas which comes with the Vevo BRAIN stereotactic frame.

Neuroanatomy of the mouse brain
3D rendered surface view of the mouse brain segmented by anatomical region based on ex vivo high frequency ultrasound images.
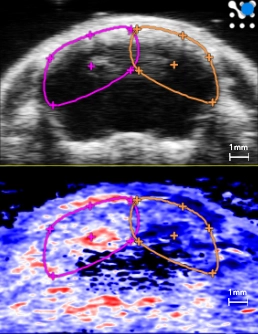
Ischemia/hypoxia stroke model
Plot of oxygen saturation (sO2) over time in the left (pink) and right (orange) cortical and subcortical hemisphere ROIs while restoring breathed oxygen to 100% from 7.5% post ischemia/hypoxia for stroke induction. Ultrasound (top) and photoacoustic (bottom) coronal images in the right panel show a frame of mouse brain post ischemia/hypoxia. The red, white and blue color represents a parametric map of oxygen saturation. The right hemisphere does not fully recover sO2 levels post-reperfusion/normoxia that are shown in the left hemisphere, indicating a cerebral infarct, especially in cortical and subcortical areas.
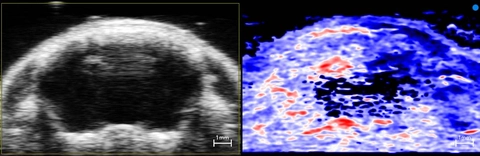
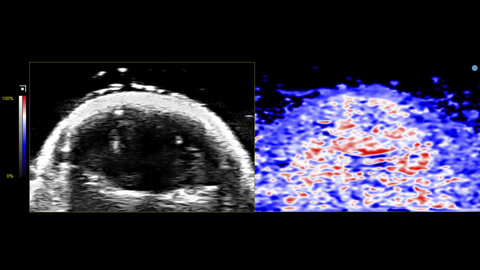
Ischemia/hypoxia stroke model
Ultrasound (left) and photoacoustic (right) coronal images of a mouse brain post ischemia/hypoxia. The red, white and blue color represents a parametric map of oxygen saturation. The right hemisphere does not fully recover sO2 levels post-reperfusion/normoxia that are shown in the left hemisphere, indicating a cerebral infarct, especially in cortical and subcortical areas.
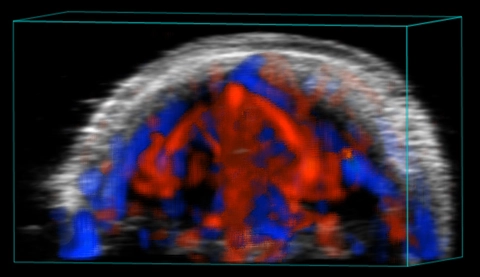
Blood flow in the neonatal rat brain
3D rendered color Doppler (red and blue) and ultrasound (greyscale) coronal image showing direction and velocity of blood flow in the neonatal rat brain.